Featured Posts

The drop happened fast! If you blinked sometime in February, you might’ve missed that we were at new all-time highs. Now? We're in full correction territory. Just yesterday, the S&P 500 fell more 2%, and now close to 10% in less than a month. Not

Did you know that 56% of Wisconsin’s agricultural exports could be impacted by tariffs from Canada, Mexico, and China? Wisconsin now represents the 11th largest exporter of agricultural products in the U.S., up from 13th in 2023 (WI DATCP). In 2024, Wisconsin’s agricultural exports reached $3.97

So, here’s something no one seems to be making a big deal about: tariffs are rising fast, and they’re dragging the US economy down. You won’t hear much about it in the headlines, but the effects could start to pile up. Higher prices, weaker growth, and more

In the past year, gold has been steadily climbing, central banks have been buying at record levels, and the macro setup could be pointing to its biggest move in decades. But, it doesn't seem like investors aren’t paying attention. Stocks dominate the headlines, and gold still carries

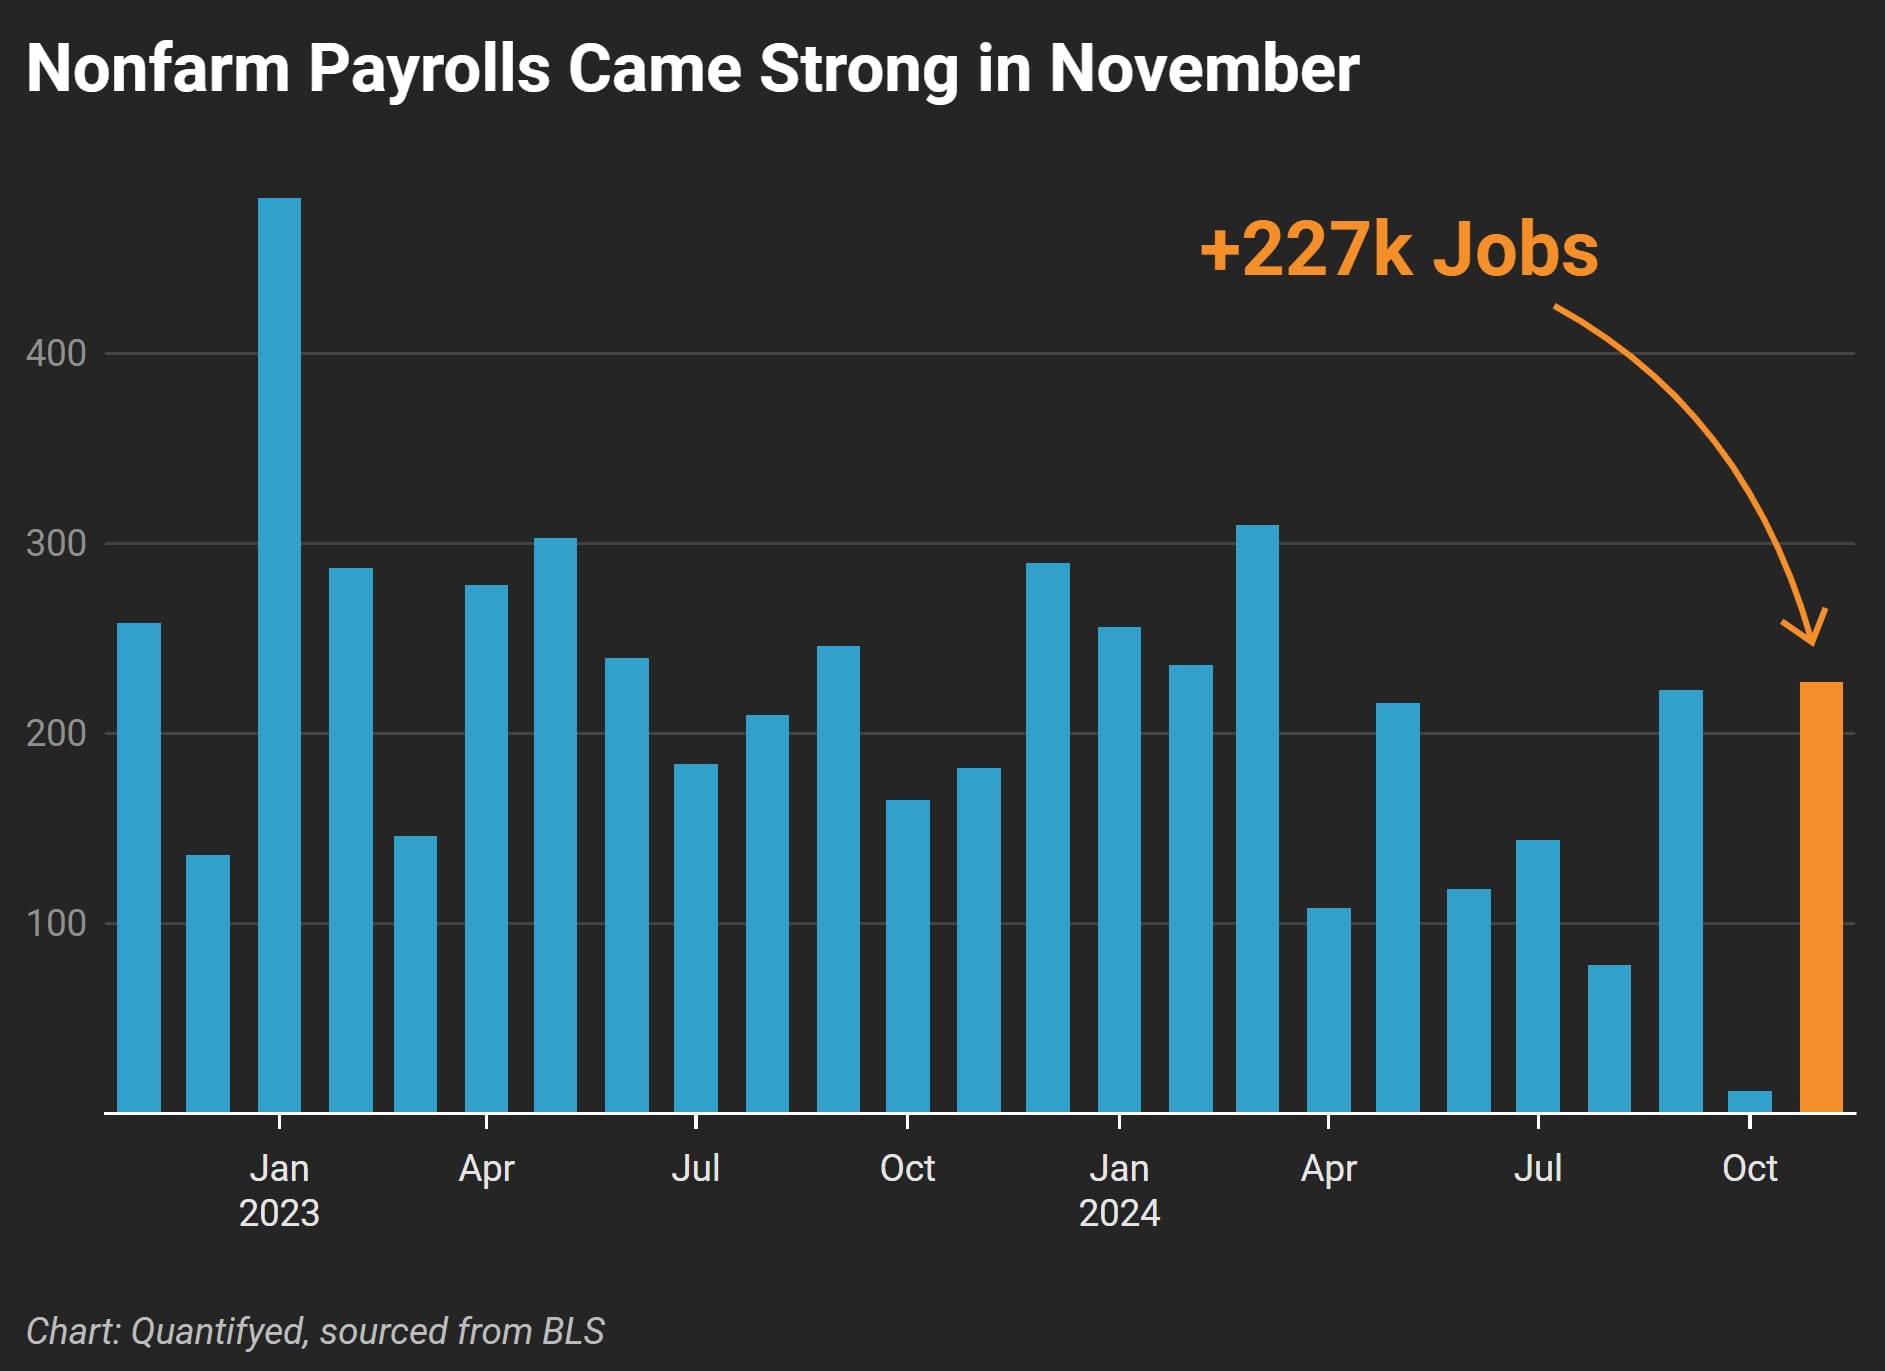
The U.S. job market bounced back in November, adding 227,000 jobs, strengthening the case for a Federal Reserve rate cut in December.
Meanwhile, corporate buybacks help drive stock prices higher, and data from Bloomberg reveals which sectors thrive—and struggle—after rate cuts. Here’s everything you need to know, explained in 4 charts.
1. Today's Jobs Report
November’s payrolls climbed 227,000, jumping from October’s low figures. While unemployment ticked up slightly, wages rose 4.1% year-over-year. This balance of job market resilience and mild cooling gives the Fed space to lower rates by 25bp this month.

2. Are Stocks Overheating?
The S&P 500 edged higher this morning on rate-cut expectations, but its price-to-book ratio of 5.3x is concerning. That level hasn’t been seen since the 2000 tech bubble. Crypto markets also rallied, despite Bitcoin already hitting $100k earlier this week.
3. Buybacks at Record Highs
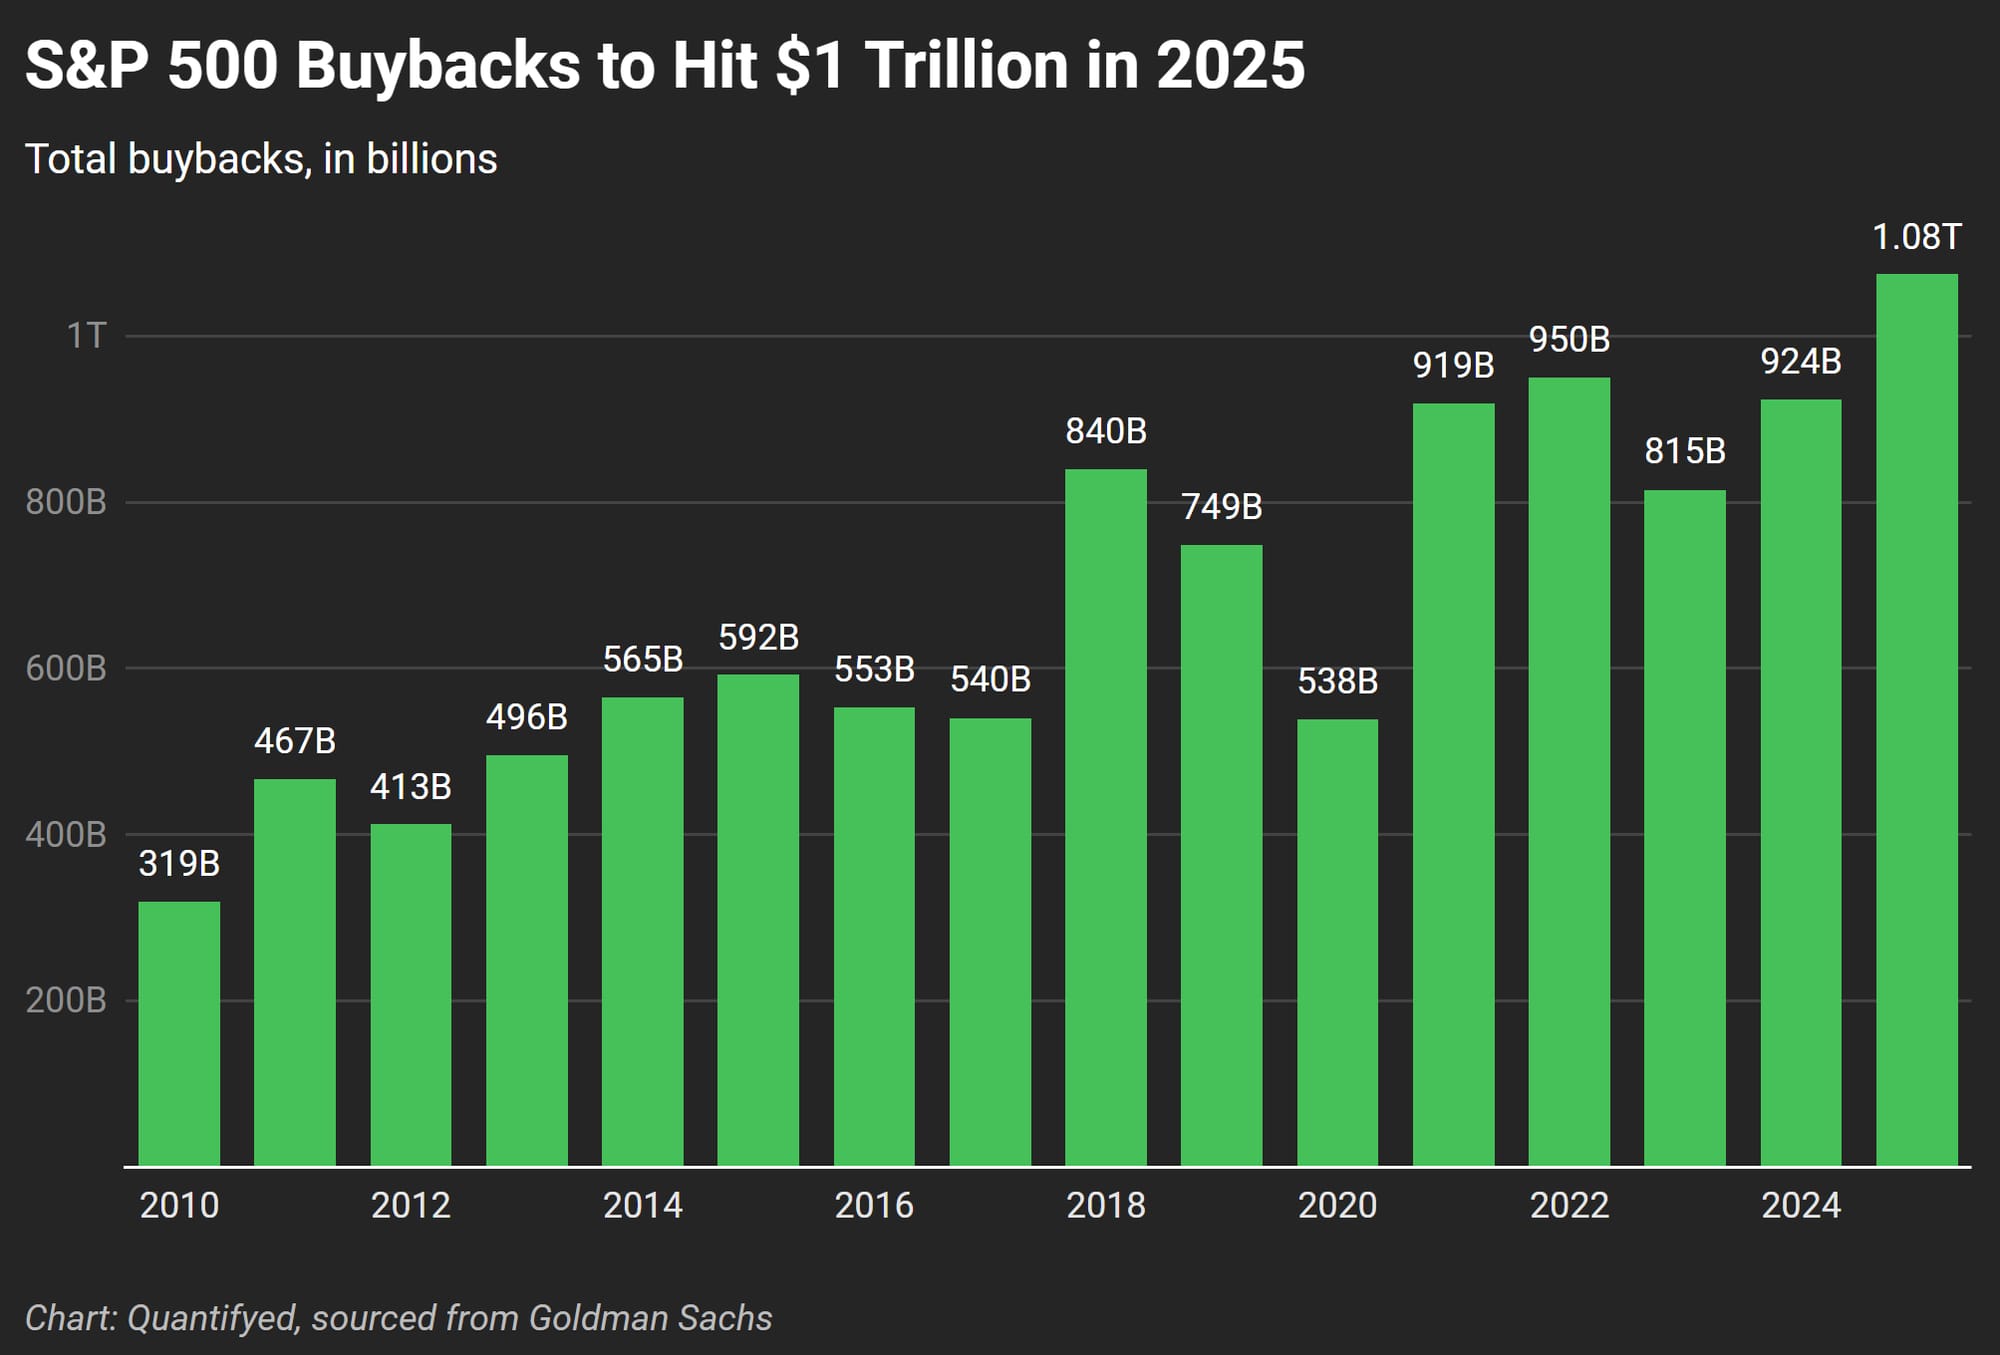
Corporate America spent $924 billion on buybacks in 2024, just shy of the $950 billion record set in 2022. Projections for 2025 suggest buybacks will surpass $1.08 trillion, the highest ever, according to Goldman Sachs.

4. Where to Invest with Rate Cuts
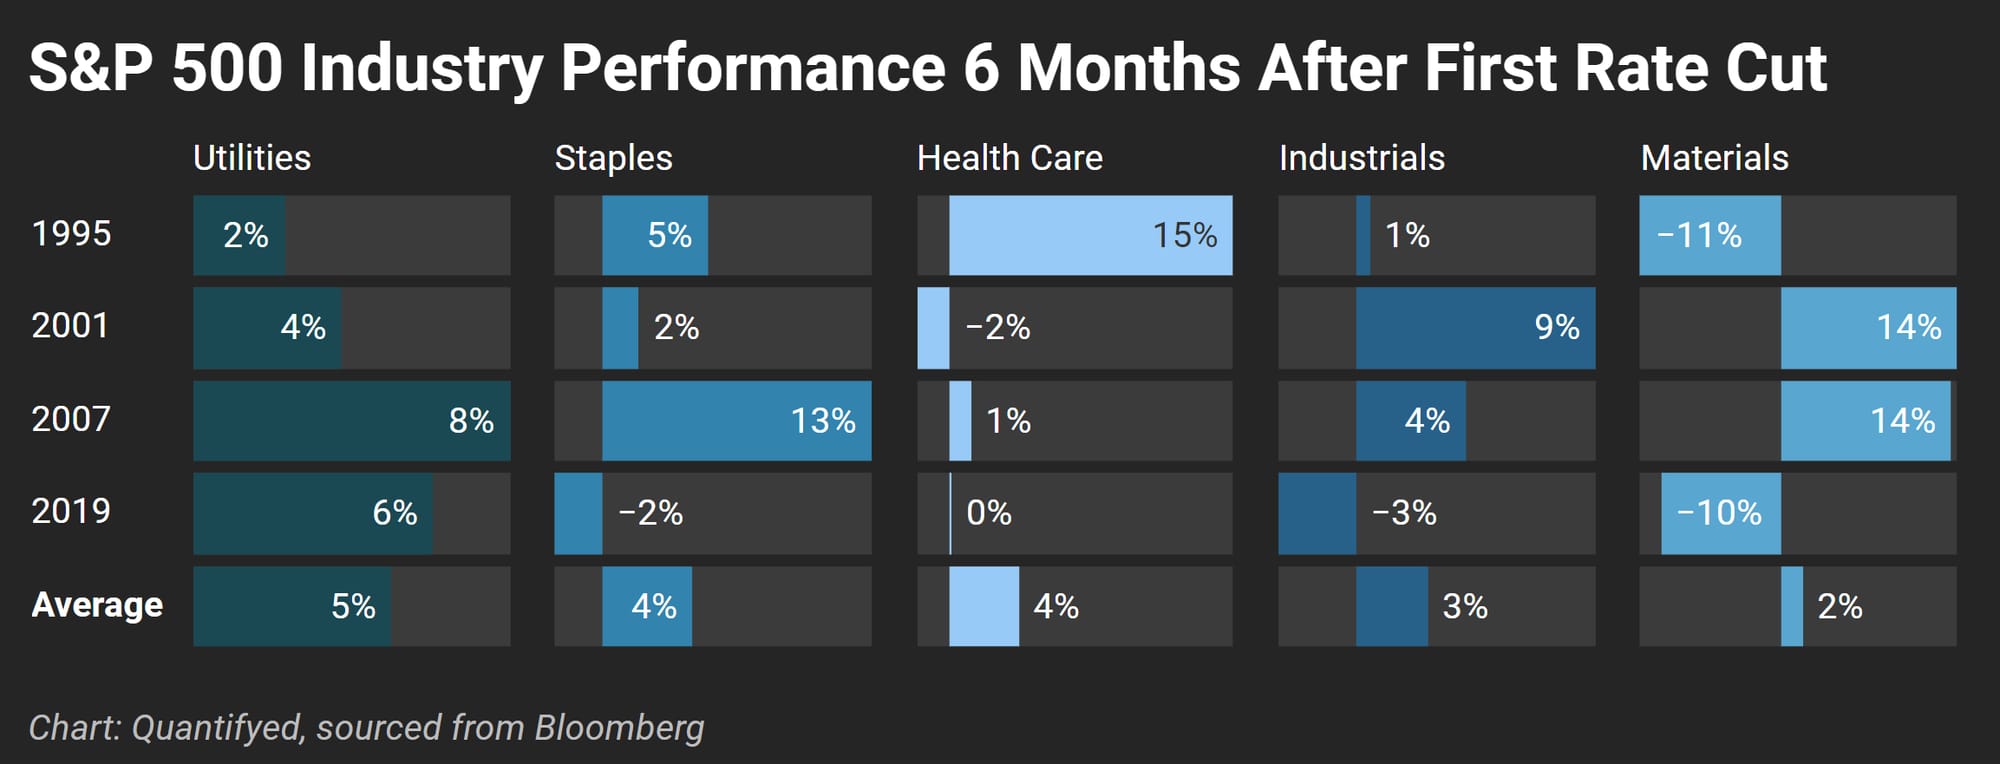
Not all sectors benefit from falling rates. Here's what some historical data tells us:
- Winners: Utilities (+5%) and Staples (+4%) had solid gains.
- Neutral: Health Care (+4%) and Materials (+2%) were stable.
- Losers: Tech (-6%) and Financials (-2%) struggle during these periods.


What It All Means
- November’s job gains support a December cut
- S&P 500 and crypto surging signal potential overheating
- There were $924b in buybacks for S&P 500 this year, and $1.08t expected in 2025.
Did you like this post? For $1/month—less than a WSJ subscription—you'll get even more content like this. If you're interested, click the button below.


