Featured Posts

Did you know that 56% of Wisconsin’s agricultural exports could be impacted by tariffs from Canada, Mexico, and China? Wisconsin now represents the 11th largest exporter of agricultural products in the U.S., up from 13th in 2023 (WI DATCP). In 2024, Wisconsin’s agricultural exports reached $3.97

So, here’s something no one seems to be making a big deal about: tariffs are rising fast, and they’re dragging the US economy down. You won’t hear much about it in the headlines, but the effects could start to pile up. Higher prices, weaker growth, and more

In the past year, gold has been steadily climbing, central banks have been buying at record levels, and the macro setup could be pointing to its biggest move in decades. But, it doesn't seem like investors aren’t paying attention. Stocks dominate the headlines, and gold still carries

Every time the market rallies to new highs, people start asking the same question: Are we in a bubble? And every time, the answer is basically the same: maybe, but we won’t know until it pops. That’s how bubbles work. They never feel obvious in real-time. The 1999

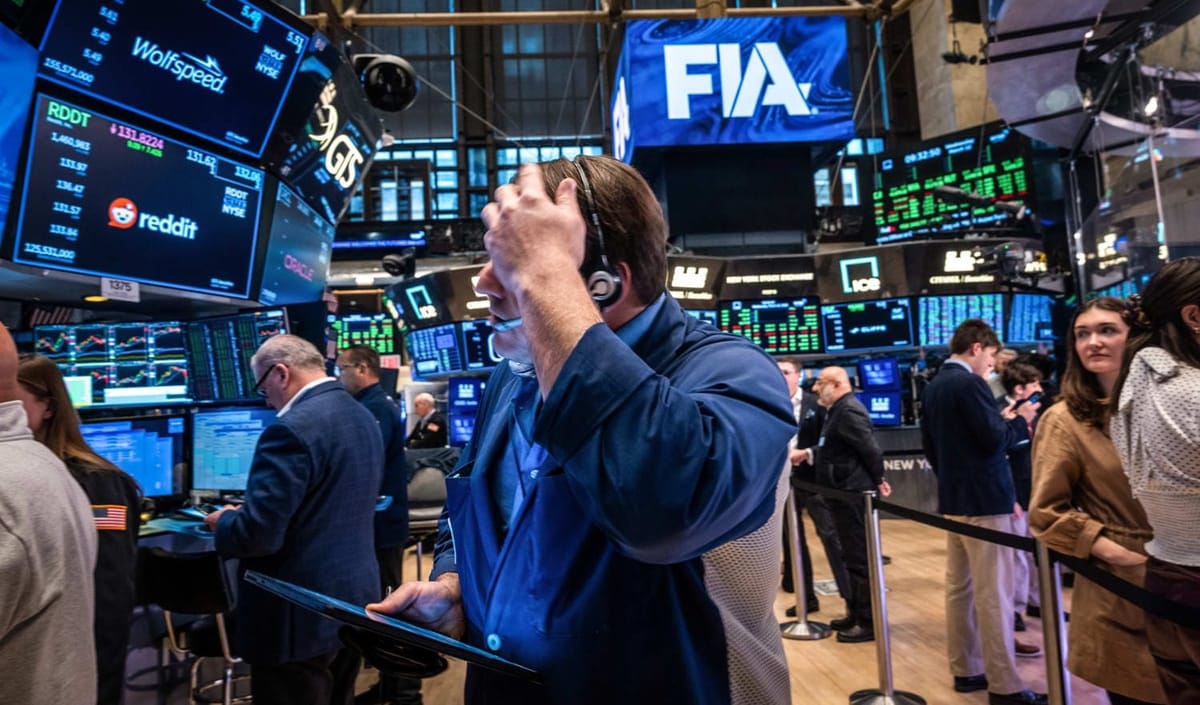
The drop happened fast! If you blinked sometime in February, you might’ve missed that we were at new all-time highs. Now? We're in full correction territory.
Just yesterday, the S&P 500 fell more 2%, and now close to 10% in less than a month. Not the worst selloff ever, but certainly spreading fear in markets.
What stands out this market selloff isn’t just the speed, it's the focus. This isn’t a global market panic. It’s mainly the US market under pressure, with a heavy lean on tech and growth stocks.
And it’s not like the economic data suddenly fell apart. It’s more of a sentiment shift… caused by policy noise, mixed Fed signals, and whatever else is floating through the headlines like trade tensions.
So let’s break down what’s actually happening, where things stand now, and what still feels unclear:
This Correction Didn’t Mess Around
To start off, the S&P 500 peaked around 5,060 on February 5. By the middle of March, it was below 4,550—a drop of over 500 points in just 18 trading days. That kind of move puts it among the fastest corrections in recent history:

These fast drops usually come with a clear shock: COVID in 2020, the volatility wipeout in 2018, the dot-com bust. This time, there’s no single reason. Just a buildup of fear and uncertainty that tipped the market over.
This Isn’t a Global Selloff
So far, it’s been mostly a US thing. As of March 28, the S&P 500 is down 5.8% since the start of February. The Nasdaq 100 is down even more—7.8%. And the Dow is off by 4.9%.
Here’s how that looks:

It’s not catastrophic, but it’s clear and concentrated. That’s what makes this feel different. A lot of global markets are actually holding up fine, which tells me this isn’t about global recession fears or major macro breakdowns. It’s about local issues.
It Started as Rotation. Now It’s More Than That.
At first, this looked like a textbook rotation. Big tech names started slipping, while more defensive sectors—things like utilities and staples—held up OK. But that’s changed.
Take a look at sector returns over the last month:

Only one sector — Energy — is in the green, and it's barely positive. Everything else is down. Technology leads the way lower, off 5%. Consumer Discretionary is down over 4%. Real Estate, Financials, and even Healthcare are all in the red.
This isn’t just a tech correction anymore. It’s moved into broad selling. When that happens, it usually says more about sentiment than fundamentals.
Valuations Came Back Down… A Bit
Before this selloff, the S&P 500 was trading above 22x forward earnings (expensive by most historical standards). After the drop, we’re back around 19.5x to 20x. That’s about where previous pullbacks in 2024 found support.
Some investors may see this as a dip-buying opportunity. Others might still feel that valuations are too high, especially with rates still elevated and forward guidance getting more cautious.
A 20x multiple isn’t exactly “cheap,” but it’s less stretched than where we started in January.

Sentiment is Getting Washed Out
A few of the usual indicators are flashing oversold:
- VIX is above 20
- RSI on the S&P is right around 30
- Over half the index is trading below its 200-day moving average
- Investor sentiment surveys are turning sharply bearish
None of this guarantees a bottom. But historically, these levels have lined up with at least short-term bounces. And you can feel it: markets have been shaky, but they’re also starting to look tired.
So, What Happens Now?
That’s the hard part. If this is just a reaction to noise—to shifting policy narratives, election volatility, and the usual Fed-speak—then maybe the worst of it is behind us.
BUT, if this uncertainty starts creeping into earnings or hiring numbers, it could go deeper.
Right now, the economic data hasn’t broken down. Earnings haven’t fallen apart. And portfolios with some diversification (outside of US large-cap growth) are holding up OK.
Corrections always feel worse while they’re happening. And they usually don’t come with a clean signal that says “we’re done.”


